
An easy strategy to reduce Google Ads CPA involves using ‘Value Track Parameters’ creatively. And lots of data analysis.
With CPMs and CPAs increasing by the day, effective ways to refine your ads strategy are hard to come by.
Rising CAC is unsustainable.
Understanding Value Track Parameters
Value Track Parameters might sound like something only a seasoned PPC specialist would understand.
But I assure you, it’s a concept that can be grasped and utilized by marketers of all levels.
These parameters allow you to capture vital information about the source of your clicks.
Thus enabling a deeper analysis of your campaign’s performance.
TL;DR: 5 Steps to Reducing Google Ads CPA
- Go into your campaign settings.
- Find the URL tracking template.
- Add {keyword} in the query string.
- Store {keyword} along with your lead data.
- Reallocate budget to best performing keywords.
Below are the steps in more detail:
1. Setting the Stage
The goal here is to append specific codes (collectively called ‘Value Track Parameters’) to your landing page URLs.
Adding within campaign settings is most effective.

For example, by creating a URL like {lpurl}?keyword={keyword}, you can track which keywords are driving traffic to your site.
This enables Google to pass on information about each click.
You can read Google’s full guide here.
2. Crafting URL Tracking Template for Insights
Your tracking template can contain multiple parameters appended e.g. I append the following template for highest visibility –
?utm_source=google&utm_medium=search&utm_campaign={campaignid}&utm_term={keyword}&utm_content={creative}
There are many more parameters you can add. The ones most popular are –

3. Accurate Keyword Tracking
Ensure your keywords are set to ‘exact’ and ‘phrase’ match types rather than ‘broad’.

4. Data Capture + Lead Tagging
Save the {keyword} value in URL, along with lead data in your CRM. Then your leads are tagged with keywords –

5. Data Analysis + $$$
Consider the following example.
Before you added Value Track Parameters, your data looked something like this –
| Keyword | Cost | CPL | Leads | Conversion | Customers | CAC |
| keyword 1 | 50000 | 500 | 100 | ? | ? | ? |
| keyword 2 | 20000 | 400 | 50 | ? | ? | ? |
| Total | 70000 | 467 | 150 | 33% | 50 | 1400 |
You know your CAC but not at a granular level.
After adding Value Track Parameters, this is how you can now see your data –
| Keyword | Cost | CPL | Leads | Conversion | Customers | CAC |
| keyword 1 | 50000 | 500 | 100 | 20% | 20 | 2500 |
| keyword 2 | 20000 | 400 | 50 | 60% | 30 | 667 |
| Total | 70000 | 467 | 150 | 33% | 50 | 1400 |
Now you know which keywords are performing poorly and which ones are not.
Also note that you need to have enough data to understand whether you can statistically replicate your wins. Read more about statistical significance here in this article on Minimum Viable Scale in Performance Marketing.
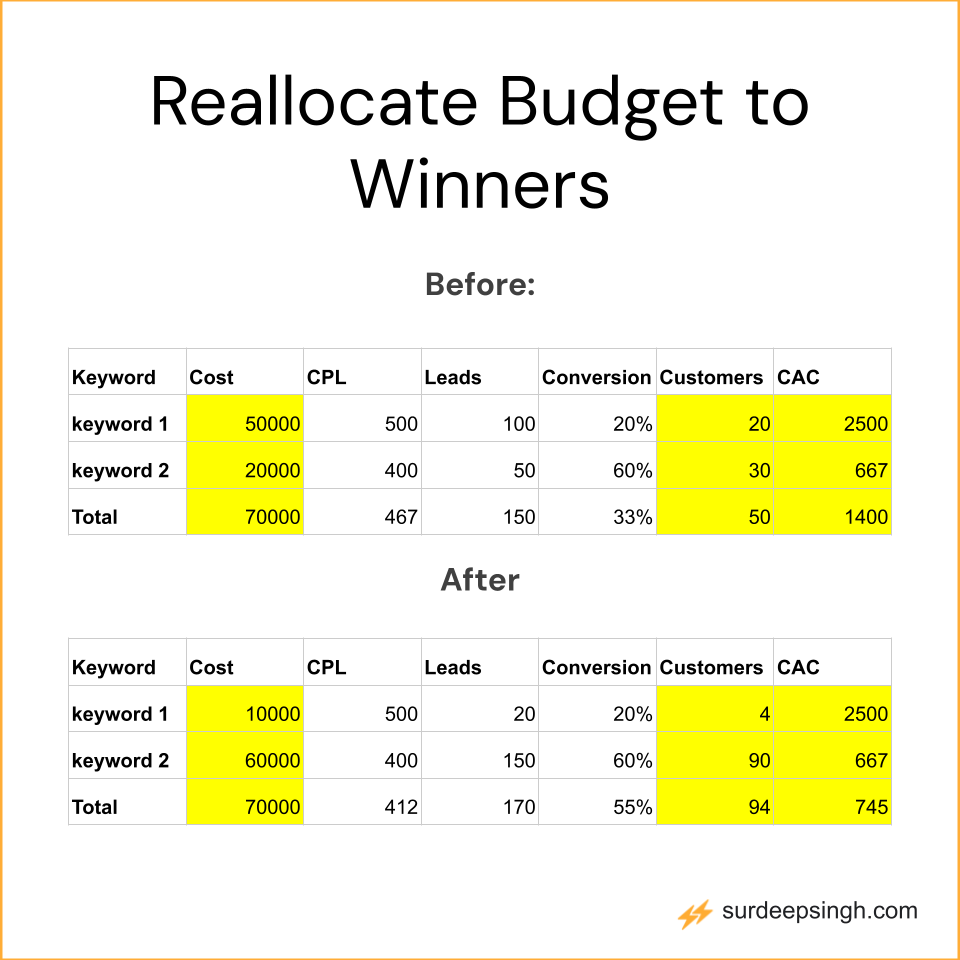
Further, you can now allocate more budget to the better performing keywords.
Earlier, this is what you had –
| Keyword | Cost | CPL | Leads | Conversion | Customers | CAC |
| keyword 1 | 50000 | 500 | 100 | ? | ? | ? |
| keyword 2 | 20000 | 400 | 50 | ? | ? | ? |
| Total | 70000 | 467 | 150 | 33% | 50 | 1400 |
After reallocating spends, this is how your CAC looks like –
| Keyword | Cost | CPL | Leads | Conversion | Customers | CAC |
| keyword 1 | 10000 | 500 | 20 | 20% | 4 | 2500 |
| keyword 2 | 60000 | 400 | 150 | 60% | 90 | 667 |
| Total | 70000 | 412 | 170 | 55% | 94 | 745 |
In our example, we’ve seen a reduction of ~47% in Google Ads CPA.
With many of my clients, I’ve seen ROAS go up by 20% – 300%!